Running a city, a building site or a logistics chain means answering the same questions every day: what changed, where and when? Satellites answer those questions from orbit, reliably, repeatedly and without driving a single kilometre. Modern commercial constellations now deliver clear optical images down to 30 cm detail, radar views that see through cloud, and temperature maps that expose hidden heat. Archive scenes start at about € 2 km²; a freshly tasked, cloud-free shot in the sharpest resolution costs nearer € 15 km². EO has therefore shifted from scientific novelty to routine data subscription.
What is Satellite Earth Observation?
Picture a camera orbiting roughly 600 km above Earth in a near-polar path that crosses the Equator at the same local time on every pass. That sun-sync timing keeps lighting consistent, vital for change detection. Agile attitude motors let the craft swivel sideways, so a city might be revisited twice a day instead of once a week. Light (or microwave energy, for radar) strikes the sensor, turns into digital numbers and is stored onboard. When the satellite flies over a ground station, it beams the data down; cloud software then corrects the geometry, so each pixel lines up with latitude and longitude. Only after that “clean-up” step do analysts or algorithms see the file.

How does a satellite take a photo?
A single overhead snapshot (mono) is perfect for mapping “what is here now?”, but some questions need height or richer change cues. Operators, therefore, schedule satellites to collect images from multiple angles during one orbit or over successive passes:


Stereo pairs two images – one taken looking forward, one backward – allowing software can triangulate building heights or terrain models at metre-scale accuracy.
Tri-stereo adds a third look (often off to the side), improving elevation accuracy and reducing occluded “blind spots” behind tall structures.


| Along-track stereo captures the fore- and aft-looking views in the same orbital pass (seconds apart), ideal for satellites that can swivel quickly and for change detection in dynamic scenes such as moving glaciers. | Across-track stereo uses side-slanted shots taken on separate passes, typically hours or days apart, trading immediacy for wider baseline and better vertical precision. |
Choosing mono, stereo, or tri-stereo – and whether the extra looks come along-track or across-track – depends on the end goal: flat maps need only one clear shot, while 3-D city models, landslide risk maps or volumetric stockpile estimates require multi-angle acquisition.
What types of photos can EO satellites take?
Satellites do not all carry the same “camera”. Four sensor families dominate, each giving a different slice of reality.
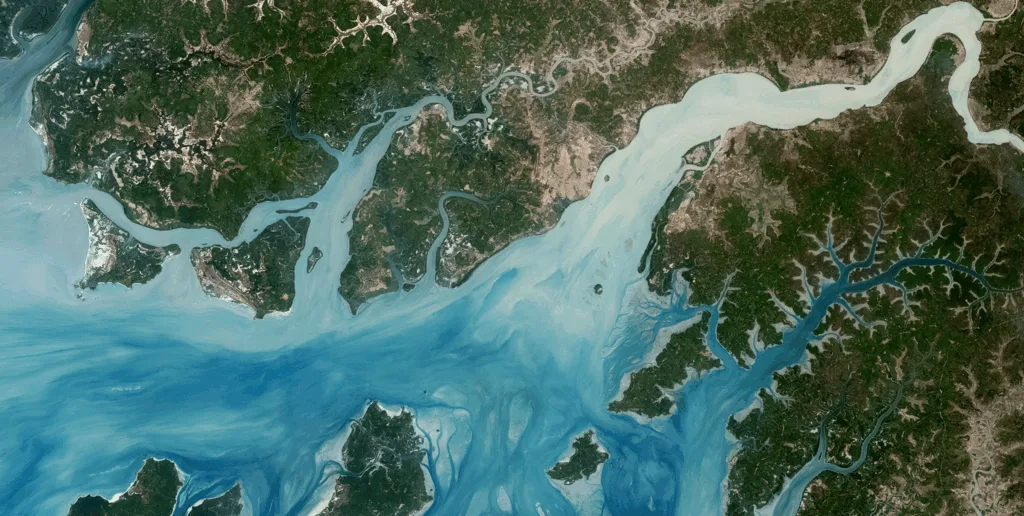
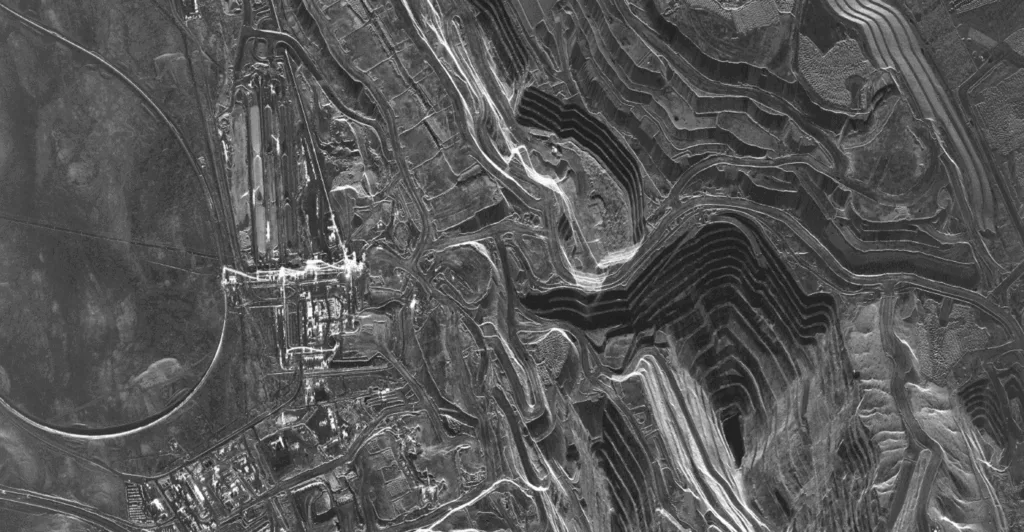
| OPTICAL Sun-lit colour & near-IR 30 cm–10 m pixels Infrastructure detail, vegetation health | SYNTHETIC-APERTURE RADAR (SAR) Surface texture via radar echoes 3 m–10 m pixels; works through cloud Flood, subsidence, ship detection |

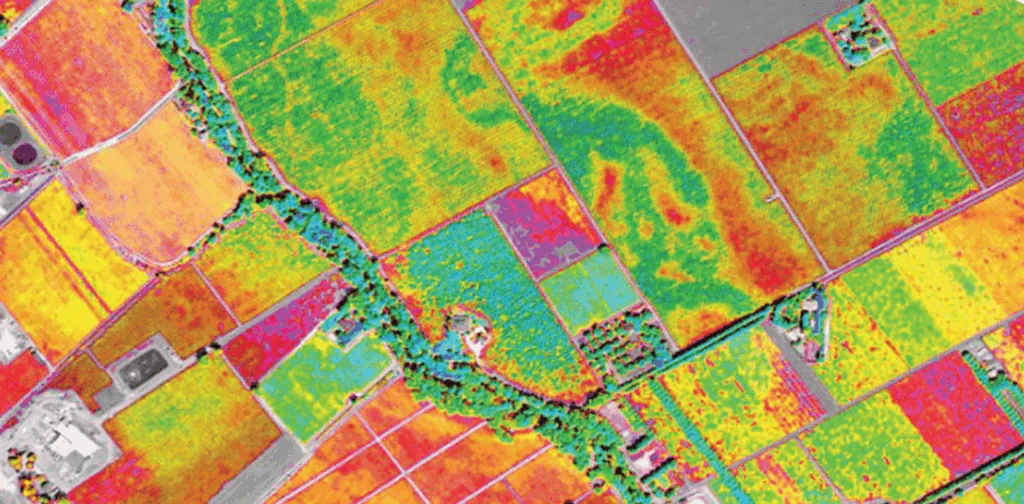
| THERMAL/INFRARED Heat emitted 50 m–100 m pixels Heat-loss, wildfire, furnace monitoring | MULTI-/HYPER-SPECTRAL Hundreds of narrow colour bands 5 m–30 m pixels Mineral mapping, crop stress, pollution |
Think of optical as eyes, radar as touch, thermal as a thermometer and spectral as a chemical sniffer. Choosing the right sensor means matching the business question to the slice of observation that reveals it.
Five ways EO satellites describe the world
“Resolution” is only part of the picture. Five attributes govern what you ultimately see and pay for.


| SPATIAL RESOLUTION Size on the ground each pixel represents Dictates whether you spot a whole warehouse or count individual assets | RADIOMETRIC RESOLUTION Number of shades recorded per pixel Separates subtle differences such as damp vs. dry soil |


| TEMPORAL RESOLUTION Time between repeat images of the same spot High revisit lets you catch change, not just take snapshots | SPECTRAL RESOLUTION How finely the sensor slices the colour (wavelength) spectrum Narrower slices reveal material fingerprints – minerals, stressed plants |

| SWATH WIDTH (SCENE SIZE) Width of ground captured in one pass Wide swaths map regions quickly; narrow scenes give finer detail |
RULE OF THUMB: Buy the lowest resolution and least-frequent revisit that still answers the business question.
What can actually be identified?
Once the right data is in hand, both analysts and machine-learning models can outline every roof, road and parking bay from 30 cm optical imagery.
- Detect ground movement of a few centimetres by stacking SAR scenes (InSAR).
- Map floodwater within hours of rain using cloud-penetrating radar.
- Reveal insulation leaks in factory roofs through night-time thermal passes.
- Flag nutrient stress in parkland or crops via subtle spectral colour shifts.
Each result is a GIS-ready layer (points, polygons, alerts) that plugs straight into dashboards or digital twins.
From raw pixels to decision-ready layers
EO data travels through four shorthand levels, each adding value:
- L0 – Raw packets: engineering only.
- L1 – Calibrated & geo-referenced: pixels now sit in the right place on Earth.
- L2 – Analysis Ready: terrain-corrected, cloud-masked, tiled.
- L3 – Analytics: finished outputs such as “new-build polygons” or “ship counts”.
Most newcomers start consuming at L2 (run their own models) or L3 (subscribe to turnkey insights). Either way, cloud catalogues expose the data via simple REST or STAC APIs, so your code fetches just the tiles it needs.
Six ways to buy insights
After pixels are converted into layers, you still need to decide how to obtain them. Satellite-data vendors package their products in a number formats; knowing the differences saves both budget and integration effort.
| ARCHIVE DATA (PER KM²) | TASKING (PER KM²) | PLATFORM SUBSCRIPTION |
| A one-off download of historical imagery for a defined area. You pick the date window that matches your project. | A new, shot captured on command. Higher price reflects satellite slewing and priority downlink. | Continuous portal access with a monthly download quota or processing allowance over a fixed region. |
| Retroactive claims, baseline mapping, change detection against older builds. | Tight construction milestones, disaster response, regulatory evidence. | Long-term monitoring programmes that need rolling access but moderate volumes. |
| BASEMAP | PROCESSED DATA | INSIGHTS & REPORTS |
| A regularly refreshed, seamless mosaic (often monthly or quarterly) at moderate resolution. | Imagery bundled with built-in algorithms (e.g., off-the-shelf change-detection or object counts) delivered as ready-made rasters or vector files. | Fully analysed outputs: risk scores, impact assessments, KPI dashboards. The vendor runs the modelling and sends the verdict. |
| Land-use dashboards, ESG compliance maps, background layers for web GIS. | Projects with limited data-science capacity that still want pixel-level detail. | Executive decision cycles where speed outranks custom analytical control. |
A useful mental rule: the farther along you move in this table, the less raw data you handle and the faster you reach an actionable answer – but the less flexibility you have to tweak methods later.
INSIGHT-AS-A-SERVICE
When EO arrives as ready-made answers
A growing slice of the EO market no longer sells pictures at all. Instead, providers run the entire chain – from satellite tasking to machine-learning analytics, and deliver only the decision trigger: a polygon, a score, or a yes/no flag that slips directly into corporate software. To understand how this works, think of three building blocks layered on top of the raw imagery stream:
EVENT DETECTION ENGINES
Algorithms search every new scene for a predefined pattern: standing water, fresh earthworks, smoke plumes, parked aircraft. When the signature appears, the service posts a time-stamped GeoJSON payload to a webhook or message queue. The client system consumes the alert exactly as it would ingest a sensor reading – there is no imagery to store or interpret.
CHANGE-MONITORING SERIES
Some questions rely on trends rather than one-off events. Here, the provider assembles a time-ordered stack of scenes, registers them to sub-pixel precision, and publishes a rolling raster that expresses movement or accumulation: millimetre ground subsidence, vegetation stress trajectories, port-yard congestion indices. Subscribers pull the fresh layer nightly into BI dashboards or digital-twin models.
RISK OR PERFORMANCE SCORING
The highest level abstracts even further, combining EO-derived layers with third-party and customer data to output a single metric per asset: flood-exposure probability, construction-progress score, roof-condition index, supply chain dwell-time KPI. Because the score travels as a lightweight JSON record, insurers, asset managers or ERP modules can drop it straight into pricing or workflow rules.Across these blocks the common thread is automation: data travels through an API, not an analyst, and lands inside systems that already make operational decisions. Technical integration usually follows one of two patterns – REST endpoints for pull workflows, or webhooks for push – and therefore fits comfortably alongside weather feeds, IoT telemetry and financial market ticks.
Image Credits:
| SatVu SpaceKnow LiveEO | GTIF Floodlight TRE ALTAMIRA |